Unit 5 - Data Management and Probability
Learning Goals for Unit 5:
- Collect, organize, describe, and label data on graphs. For example, your child's class may tally the number of days there is rain, snow, sun, or clouds during a month and graph the results.
- Read graphs and ask questions about the data they gathered.
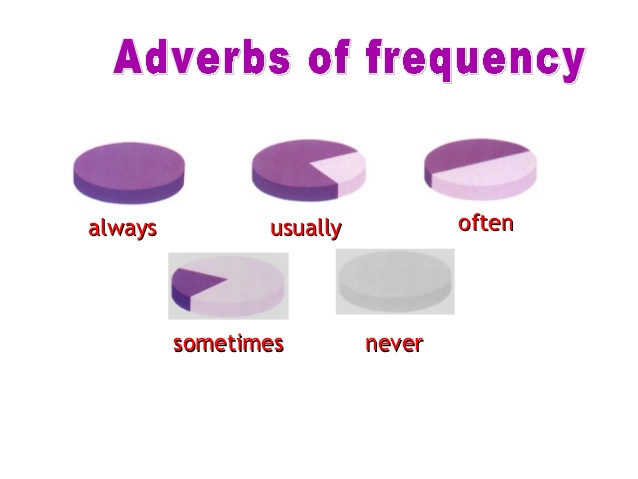
- Talk about probability in day-to-day situations using words such as always, sometimes, or never to describe events. For example, it sometimes snows in Spring in Canada.
- Use mathematical language such as likely,unlikely, and probably when playing games. For example, I think the spinner will likely land on red.
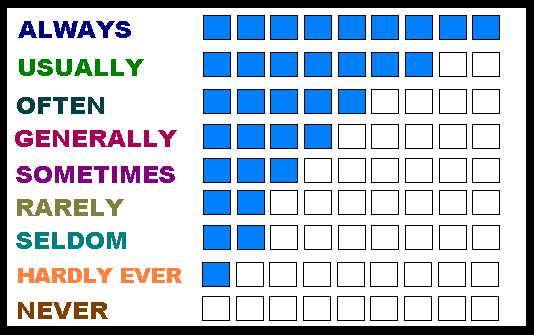
Probability and Mathematical Language
|
|
|
Students should be able to understand how likely or unlikely something is to occur.
Activity: Place 10 red pieces of paper in a bag and 5 blue pieces of paper from the bag. Take a piece from the bag. Record which colour it was and put the piece back in the bag. Repeat. Race to ten! Which of the two colours should win? Why? |
Surveys, Tally Charts, and Graphing
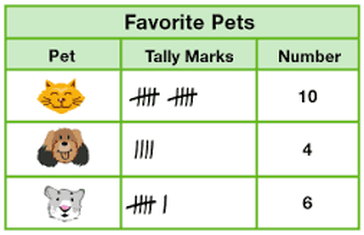
The picture above is a TALLY CHART explaining the results/data from a SURVEY that you could conduct with friends and family. A survey is when you ask a specific question with some options provided. For example, what is your favourite type of pet? Cats, dogs, or hamsters? The people you ask must then choose on of those pets which are provided. When doing a survey, one of the best ways to record your results/data is to use a tally chart. Don't forget that to show 5, you must put a horizontal line through the 4 vertical lines.
|
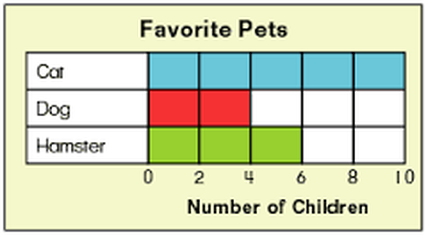
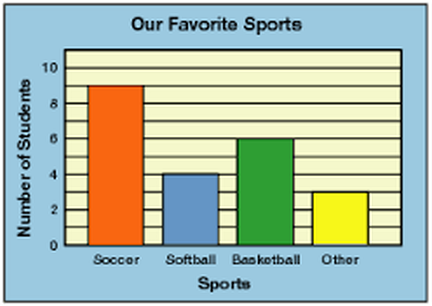
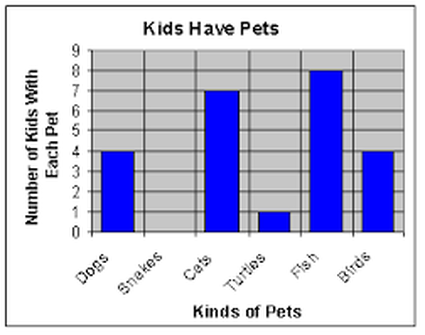
The picture above is a horizontal GRAPH showing the results/data from the TALLY CHART that you created for your SURVEY. The information above provides a great picture of the information you collected about favourite pets. You can now clearly show the three types of pets and the number of children who like each the best. When making a graph, DO NOT FORGET YOUR TITLE, SUBJECTS, and FREQUENCY (number of people/things).
|
|
|
